Manufacturers are collecting more data than ever before. But when it comes to visualisation and utilisation of data, many manufacturers fall short – storing data in separate repositories and various spreadsheets that are hard to understand and access. Dashboards aim to solve this issue by transforming data into accessible and understandable information.
Manufacturers collect data from an array of sources, including MES systems, MRP systems, ERP solutions and more. But this data, while containing many useful insights for the business, is often in a format that is difficult to interpret and extract insights from – leaving many manufacturers wondering how they can drive change and OPEX with their software and machinery solutions.
Manufacturing dashboards are used to collect and aggregate various data sources into one central location, displaying information in a simple format. This gives the organisation a single point of truth and drastically reduces time spent collating and interoperating an array of information.
Manufacturing dashboards can collect and aggregate various data in a single interface, reducing the amount of time staff have to
spend collating information and providing access to the information that matters.
Benefits of using dashboards
We know that data can be powerful for improving operations, but how do you gain the most value from the data your business is collecting? There are three key ways to gain maximum benefits and to tell a story with the data available.
Make complex information simple
Operating in the age of Industry 4.0 and IIoT, manufacturers are collecting more information than ever before. Dashboards are able to take this information and remove the clutter – giving you access to information that matters.
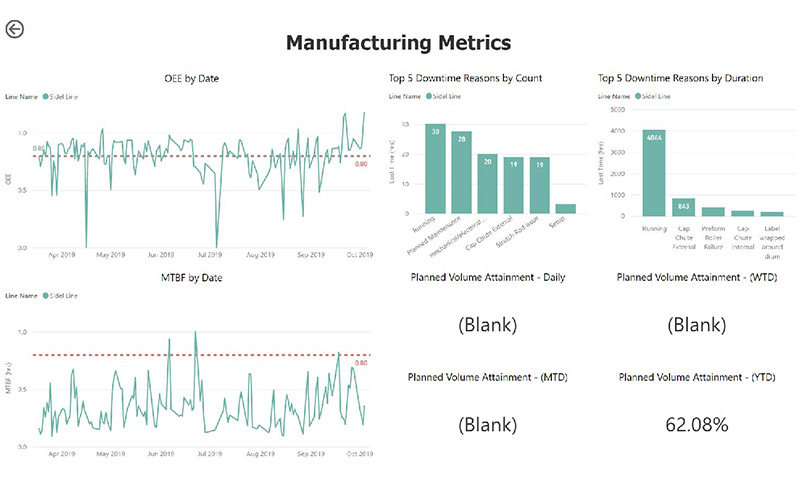
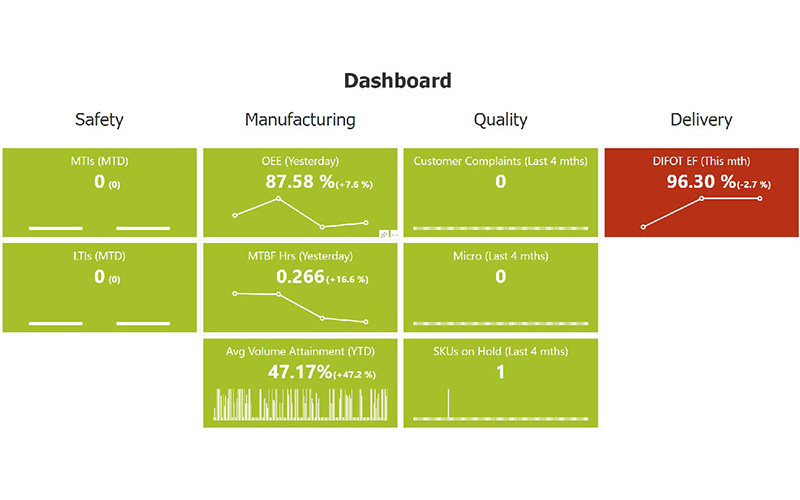
Effective manufacturing dashboards are able to transform your production information into meaningful data visualisations with the use of simple and easy to understand graphics and charts. These visualisations are able to provide operators and managers with a clear insight into their production performance and can be used to get a quick snapshot of overall performance.
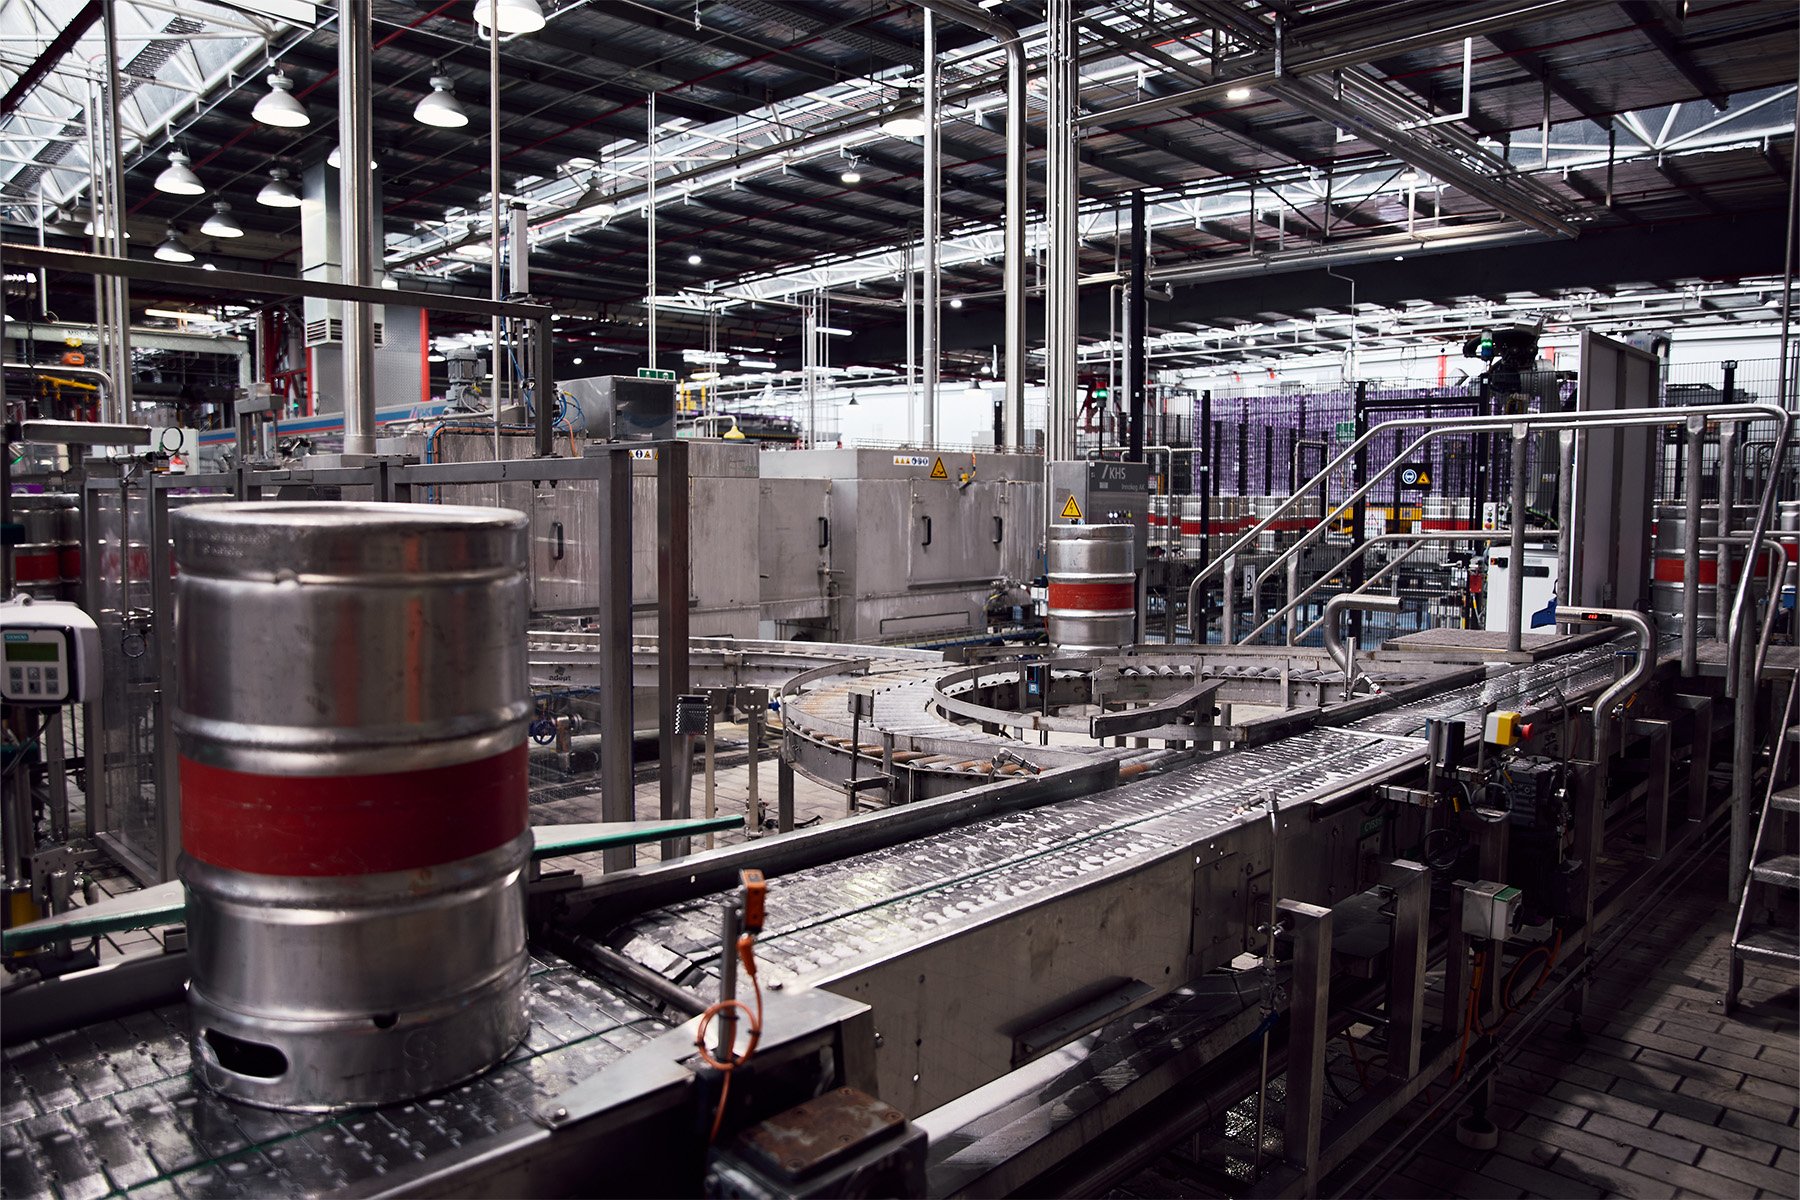
Dashboards can be displayed on large screens throughout the production facility, providing everyone on the shop floor with a clear overview of their manufacturing performance. Utilising graphics and colors, the complexity of the dashboards is customised by you. This can be as simple as green means you’re running well, and red means you’re in a downtime.
 Dashboards can provide insight into operations at a quick glance — so it is possible to quickly identify areas of poor performance.
Give the right information to the right person at the right time
Dashboards are flexible by nature. They can take most sources of information and transform that data into information that can be used to get a better understanding of operational performance.
This gives manufacturers the opportunity to build highly personalised dashboards that deliver the right information to the right person at the right time.
For example, a manufacturer would be able to create a dashboard that displays all the information from a line performance monitoring solution like OFS and showcase this to the Production Manager who is charged with monitoring the line performance. You might also create a dashboard that utilises this data alongside data from another tool, like an ERP or MRP, to show, on a visual level, the cost versus production output for a General Manager who is charged with improving overall production efficiency.
Connect data sources
With tight operational margins, manufacturing relies on a growing number of factors. This includes scheduling, budgeting, operational performance, and logistics (to name but a few). Each of these factors needs to function as part of a well-oiled machine for manufacturers to remain profitable.
Dashboards are able to integrate the data from each of these sources (such as integrating an ERP for financial and logistics information, with a line performance tool like OFS for production performance information) into a single repository – allowing you to not only monitor the performance of a single factor, but to compare factors and monitor how their relationships affect each other.
This allows trend analysis, gives you the ability to monitor the flow-on effects between different manufacturing departments and significantly reduces the time spent compiling and aggregating different data sources.
Conclusion
By now you can see that harnessing operational data and displaying it within an easy-to-understand visual chart allows for greater efficiencies within the business. For many manufacturers, having a single source of truth represented in a simple data visualisation engages stakeholders. Dashboard tools enable increased information sharing across the business, making it easier to identify under performance or inefficiency in processes. With this enhanced visibility and knowledge, improvement opportunities can be more easily identified, encouraging change.
About OFS
OFS (Operations Feedback Systems) is a software solutions company, delivering power tools that integrate real-time manufacturing data, operator input, digitised forms and workflows. Nukon partners with OFS to deliver fit-for-purpose, cost-effective digital solutions.
Are you searching for a way to capture and visually represent operational data in one place? Speak with a Nukon consultant about opportunities to leverage the data of your business.